Stale warning
This protocol has not been updated this year! Last update was on June 28, 2022.
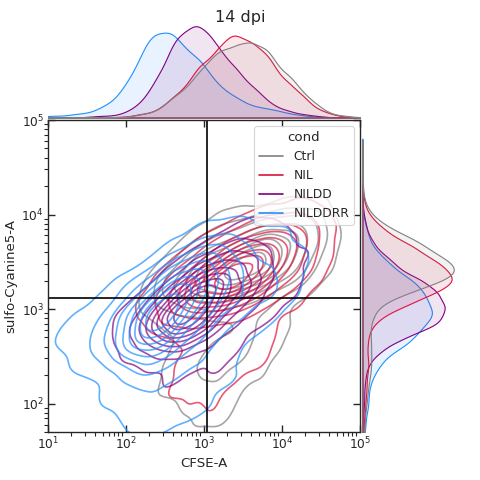
Flow plots with adjunct histograms
# Read in data
data = pd.read_csv('data/data_flow_with_adjunct_hist/data_flow_with_adjunct_hist.csv')

# Randomly sample 10^4 samples from each condition to make representative flow diagram
numSamples = 10**4
small_data = data.groupby(['cond']).sample(n=numSamples, random_state=1)

# General plotting params
x = 'CFSE-A'
y = 'sulfo-Cyanine5-A'
hue = 'cond'
cond_list = ['Ctrl', 'NIL', 'NILDD', 'NILDDRR']
colormap = {'Ctrl': 'grey', 'NIL': 'crimson',
            'NILDD': 'purple', 'NILDDRR': 'dodgerblue'}

# definitions for the axes
left, width = 0.1, 0.65
bottom, height = 0.1, 0.65
spacing = 0.005

rect_scatter = [left, bottom, width, height]
rect_histx = [left, bottom + height + spacing, width, 0.2]
rect_histy = [left + width + spacing, bottom, 0.2, height]

# Set up figure
fig = plt.figure(figsize=(6, 6))
ax_scatter = plt.axes(rect_scatter)
ax_scatter.tick_params(direction='in', top=True, right=True)
ax_histx = plt.axes(rect_histx)
ax_histx.set_axis_off()
ax_histy = plt.axes(rect_histy)
ax_histy.set_axis_off()

# Set limits
xlim = (10, 1*10**5)
ylim = (5*10**1, 1*10**5)
ax_scatter.set_xlim(xlim)
ax_scatter.set_ylim(ylim)
ax_histx.set_xlim(xlim)
ax_histy.set_ylim(ylim)

# Make density plots
sns.kdeplot(ax=ax_scatter, data=small_data, x=x, y=y, hue=hue, hue_order=cond_list,
            log_scale=True, common_norm=False,
            palette=colormap, alpha=0.7, fill=False, legend=True)

# Plot histograms
sns.kdeplot(ax=ax_histx, data=small_data, x=x, hue=hue, hue_order=cond_list,
            log_scale=True, common_norm=False,
            palette=colormap, alpha=0.1, fill=True, legend=False)
sns.kdeplot(ax=ax_histy, data=small_data, y=y, hue=hue, hue_order=cond_list,
            log_scale=True, common_norm=False,
            palette=colormap, alpha=0.1, fill=True, legend=False)

# Add in CFSE and EU lines
CFSE_low_thresh = np.percentile(data[(data['cond'] == 'Ctrl')]['CFSE-A'],  20)
EU_thresh = np.percentile(
    data[(data['cond'] == 'NIL') & (data['CFSE_cat'] == 'CFSE-low')]['sulfo-Cyanine5-A'], 50)
ax_scatter.axvline(CFSE_low_thresh, 0, 1, color='black')
ax_scatter.axhline(EU_thresh, 0, 1, color='black')

# Title
fig.suptitle('14 dpi')
# Misc plotting stuff
fig.tight_layout()  # Helps improve white spacing
plt.show()
(Source code, png, hires.png, pdf)