Stale warning
This protocol has not been updated this year! Last update was on June 21, 2022.
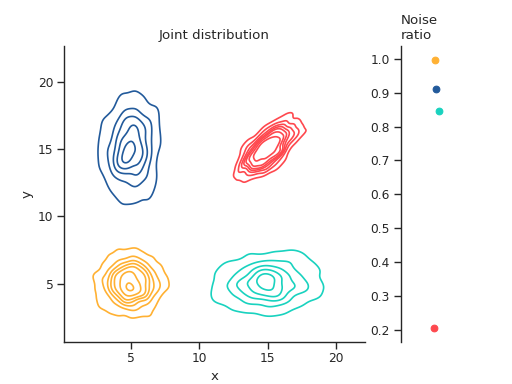
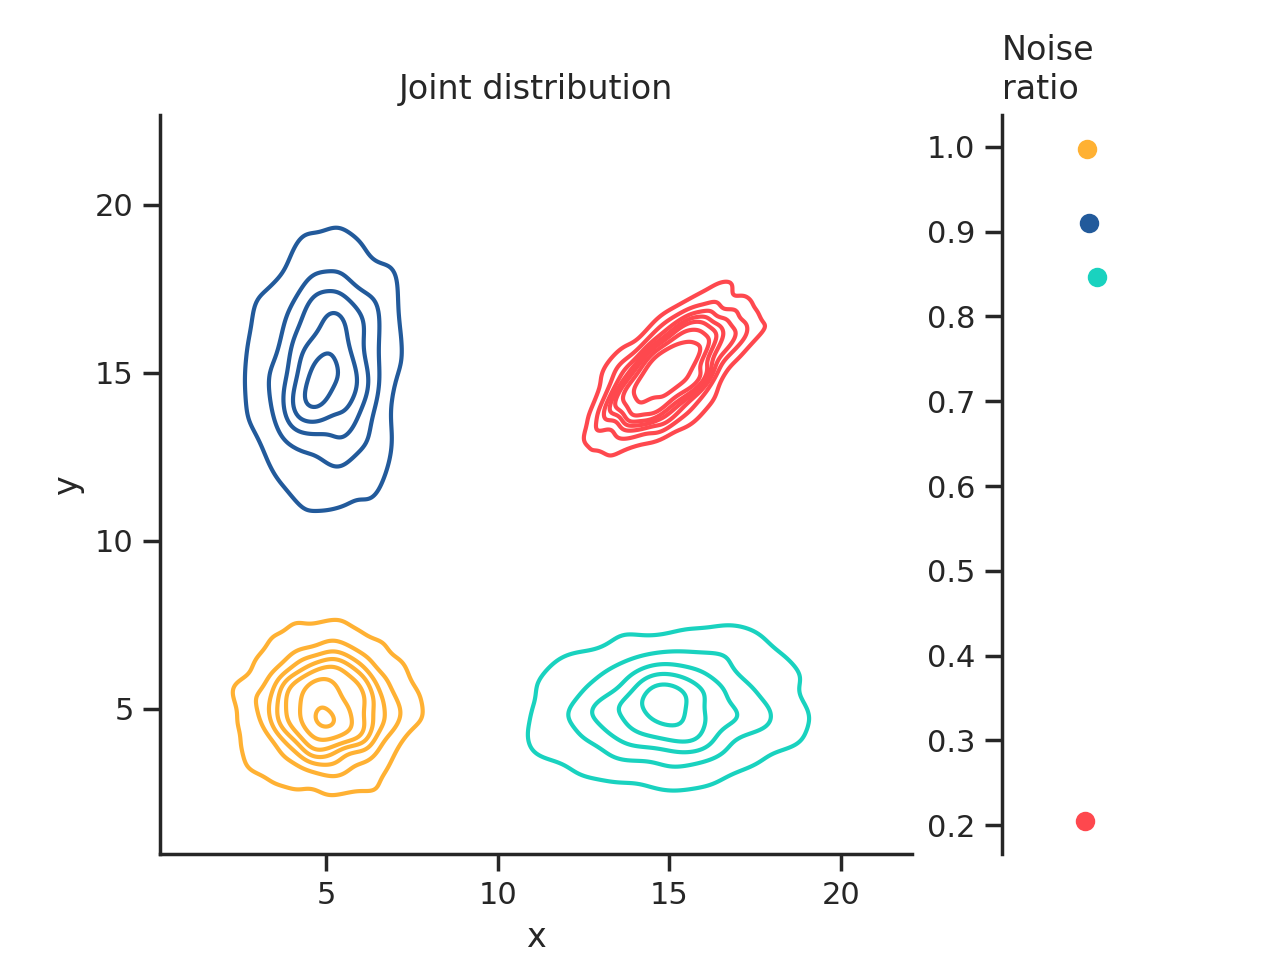
Multiple-axes plots
# -------- EXAMPLE DATA GENERATION --------------------
# Generate example data. Each condition will
# be a differently-sized and placed bivariate normal
# distribution.
np_rand = np.random.RandomState(seed=2022)
example_data = np.vstack((
    np_rand.multivariate_normal( # A
        [5, 15],[[1,0.2], [0,3]], size=(1000,)),
    np_rand.multivariate_normal( # B
        [15, 5], [[3,0], [0.2,1]], size=(1000,)),
    np_rand.multivariate_normal( # C
        [5, 5], [[1,0], [0,1]], size=(1000,)),
    np_rand.multivariate_normal( # D
        [15, 15], [[1,1], [0.2,-0.2]], size=(1000,)),
))
df = pd.DataFrame({
   'condition': (
        (['A'] * 1000) + (['B'] * 1000) +
        (['C'] * 1000) + (['D'] * 1000)
    ),
   'x': example_data[:,0],
   'y': example_data[:,1]
})
# -------- END EXAMPLE DATA GENERATION ---------------

# Specify a color palette
beach_towel = {
'A': '#225A9B',
'B': '#19D2BF',
'C': '#FFB133',
'D': '#FE484E',
}

# Create a multi-plot subplot layout, where we specify
# a one-row, two-column set of plots, where the first
# axis takes five times the space as the right axis.
_, axes = plt.subplots(
                ncols=2,
                sharey=False,
                gridspec_kw={'width_ratios': [5,1]})
# Use Seaborn to plot the joint distributions.
sns.kdeplot(data=df, x='x', y='y',
            hue='condition', palette=beach_towel,
            levels=8,
            ax=axes[0], legend=None)
# For each condition, calculate intrinsic and extrinsic noise
for condition in df.condition.unique():
    # subset the dataframe by condition
    df_subset = df[df.condition == condition]
    extrinsic_noise = np.var((df_subset.x + df_subset.y) / 2.0)
    intrinsic_noise = np.var((df_subset.x - df_subset.y) / 2.0)
    # use matplotlib to plot circles for each condition.
    # Jitter the x-axis locations so the dots don't overlap.
    axes[1].plot(
        np.random.uniform(-0.1,0.1),
        intrinsic_noise / extrinsic_noise,
        'o',
        color=beach_towel[condition])
# Modify axis titles
axes[0].set_title('Joint distribution')
axes[1].set_title('Noise\nratio', loc='left')
# Set uniform x and ytick labels
axes[0].set_xticks([5,10,15,20])
axes[0].set_yticks([5,10,15,20])
# Despine both axes, also removing the bottom spine
# on the right axis.
sns.despine(ax=axes[0])
sns.despine(ax=axes[1], bottom=True)
# Hide the right-most x axis.
axes[1].xaxis.set_visible(False)
# Scale the axis so our jittered points are visible.
axes[1].set_xlim([-0.3, 0.3])
(Source code, png, hires.png, pdf)
