Stale warning
This protocol has not been updated this year! Last update was on June 21, 2022.
Testing matplotlib directives
Subheading
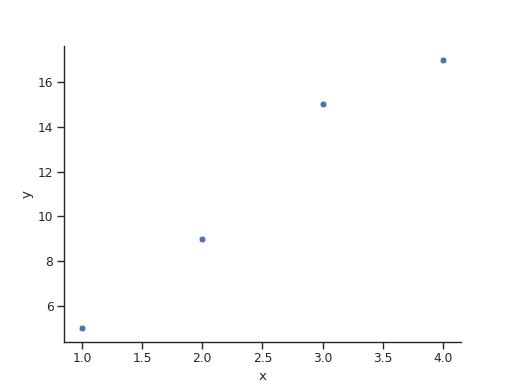
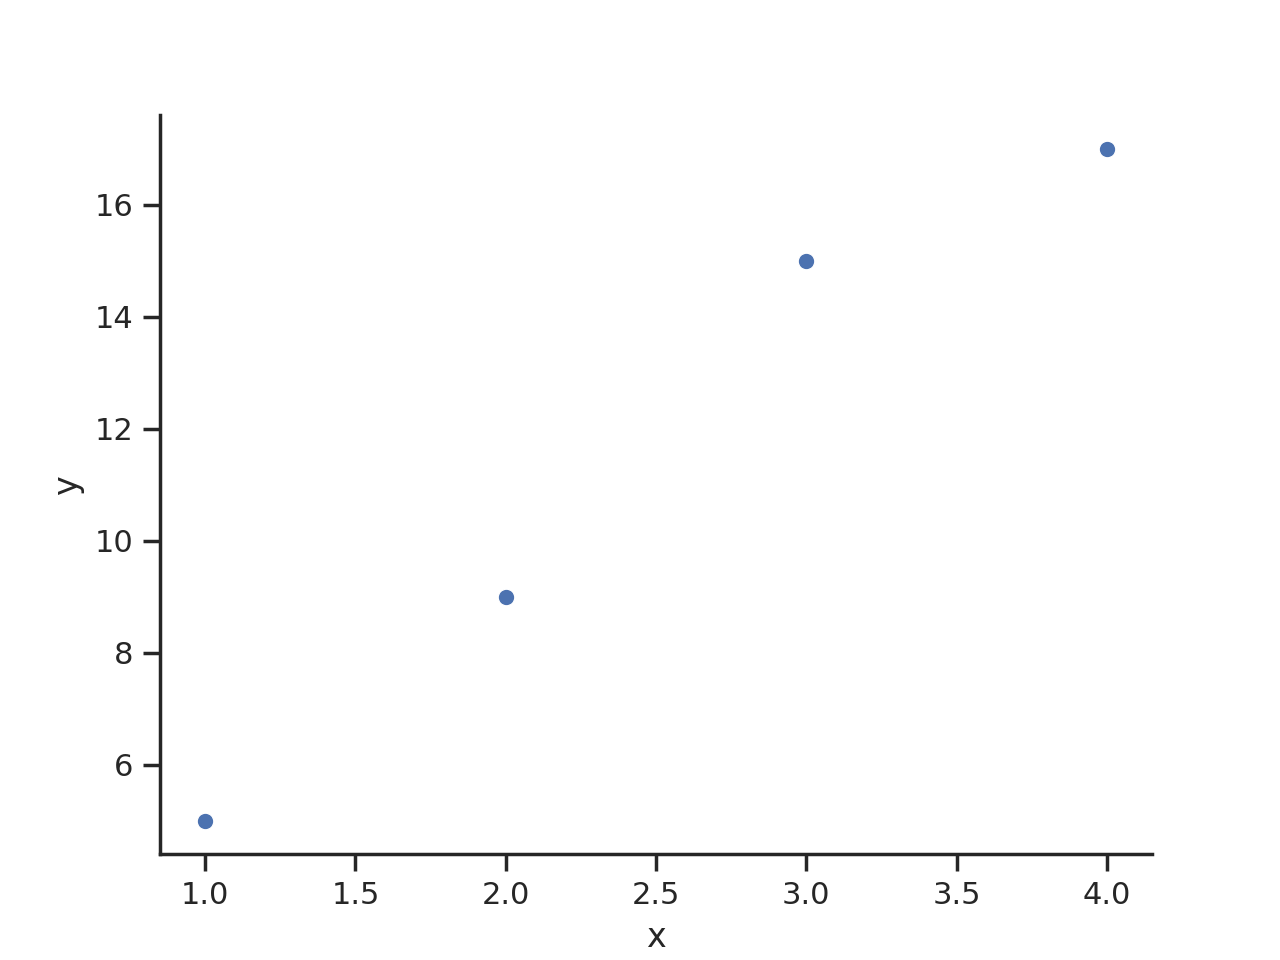
df = pd.read_csv('data/test_data.csv')
sns.scatterplot(data=df, x='x', y='y')
sns.despine()
plt.show()
(Source code, png, hires.png, pdf)
